Chapters
- 1 Getting started
- 2 The interface
- 3 Coordinate systems and conventions
- 4 Modelling
- 5 Materials
- 6 Sections
- 7 Supports, releases and modifiers
- 8 Loads
- 9 Load combinations
- 10 Meshing
- 11 Static analysis
- 12 Dynamic and seismic analysis
- 13 Results
- 14 Design
- 15 Scripting and the AI model builder
- 16 Import and export
- 17 Verification
- 18 Scope and limits
- 19 Troubleshooting
- 20 Glossary and notation
On this page
The FEA Tool window has five parts: the header bar across the top, the workspace panel on the left with one page per tab, the model view in the middle with the modelling toolbar beside it, the properties panel on the right, and the bottom dock of result tables below the model view. A status bar runs along the foot of the model view. Every panel can be hidden or resized, so a laptop screen can give most of its width to the model.
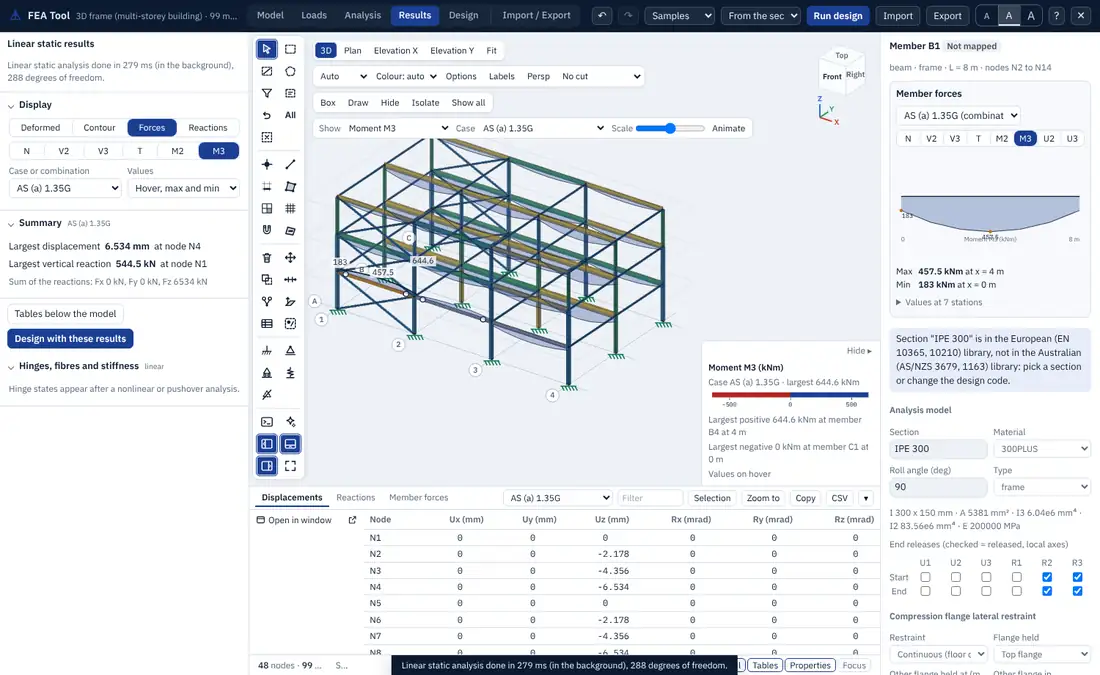
2.1 The window at a glance
| Part | Where | What it holds |
|---|---|---|
| Header bar | top | the tabs, undo and redo, sample models, the design code, Run design, Import, Export, text size, help and close |
| Workspace panel | left | the page of the current tab: Model, Loads, Analysis, Results, Design, Import / Export |
| View toolbar | top of the model view | standard views, display options, selection display and the result display |
| Modelling toolbar | left edge of the model view | selection, drawing, editing, supports, script console, AI model builder and the panel switches |
| Model view | middle | the model in 3D with the view cube, labels, symbols, diagrams, contours and the legend |
| Properties panel | right | the selected node, member or area: its data, its results and its design |
| Bottom dock | below the model view | result tables: displacements, reactions, member forces, modes and more |
| Status bar | foot of the model view | model size, selection, pointer coordinates, view notes and the display units |
2.2 Header bar
The six tabs follow the order of the work: Model, Loads, Analysis, Results, Design and Import / Export. Alt+1 to Alt+6 switch between them.
- Undo and Redo (Ctrl+Z, Ctrl+Y) step through the edit history of the model.
- Samples opens one of the sample models: an AS portal frame, a US braced frame, an EU frame and an AS frame read from a SPACE GASS file. Each sample shows one of the import formats at work.
- Design code sets the code system of the design: From the sections (the code of the section libraries used), Australia (AS), United States (US), Canada (CA) or Europe (EN). The code also chooses the section and material libraries offered first, the generated load combinations and the default seismic parameters.
- Run design designs every member in its module (Chapter 14).
- Import reads a model file and Export writes one (Chapter 16).
- The three A buttons set the text size of the window.
- ? lists the keyboard shortcuts, and the close button returns to the app.
The title next to the tool name shows the model name and a short summary, for example the number of members.
2.3 Workspace panel and tabs
Each tab fills the workspace panel with folding sections. A section heading shows a short note on its right, such as the number of load patterns. Sections that need a model say so until one is open.
| Tab | Sections |
|---|---|
| Model | New model, Code libraries, Supports releases and roll angle, Nodes and members, Model check, Save and open, Areas, Materials, Frame sections, Area sections, Auto select lists, Section drawing, Section designer, Property modifiers end offsets and mesh, Hinges |
| Loads | Load patterns, Loads in the current pattern (members and nodes), Area loads, Temperature loads, Area springs, Joint patterns, Load combinations, Mass for modal and dynamic analysis |
| Analysis | Analysis type, Parameters, Run, Seismic and dynamic setup, Your own spectra and records |
| Results | Display, Summary, Hinges fibres and stiffness, Modes, Area results, Slab and wall design, Storey and irregularity report, Response spectrum, Time history, Equivalent lateral force |
| Design | Batch design, Design inputs, Optimise sections, Design Expert |
| Import / Export | Import, Export |
Drag the edge between the workspace panel and the model view to make the panel wider or narrower.
2.4 Model view
The model view draws the model in 3D with WebGL. Members are drawn as extruded true section shapes on their local axes and roll angles, or as lines; areas are drawn filled or as edges. Drag to orbit, right-drag or Shift-drag to pan and use the wheel to zoom. On a touch screen or trackpad one finger orbits and two fingers pan and pinch to zoom. The view draws only when something changes, so an idle window uses no processor time.
View toolbar. The first group sets the view: 3D, Plan, Elevation X, Elevation Y (keys 1 to 4) and Fit (F). The view cube at the top right turns with the camera; click a face of the cube for that standard view.
The second group sets what is drawn:
- Auto / Sections / Lines (M): members as extruded sections or as lines. Auto draws lines above 1,500 members so that very large models stay smooth, and the status bar says when it has done so.
- Colour: members coloured by material, section or utilisation (auto uses utilisation once a design has run).
- Options: fill areas, extrude frames, show the analysis model (the element mesh of the areas and the ends of members split by the mesh), show joints, and show the local axes of the frames (1 red, 2 green, 3 blue). The choices are remembered in the browser.
- Labels (L) and Persp (P, perspective or parallel projection).
- Cut: a section plane that shows one storey, or everything up to a level.
The third group acts on the display of the selection: Box (B) selects with a box, Draw (D) draws members between nodes and grid points, Hide (H) hides the selection, Isolate (I) shows only the selection and Show all (Shift+H) brings everything back.
The fourth group appears once results exist: Show (model only, deformed shape, axial force, shears, torsion, moments, reactions, mode shapes, buckling shapes, time history), Case (a load case, combination, mode or time step), Scale (a slider for the size of the deformed shape or diagram) and Animate (Space), which animates a mode shape or plays a time history.
Legend. Whenever the colours or bands of the view carry values, a legend at the lower right gives the quantity, its unit, the case, a scale and the largest and smallest values with the node or member where they occur. Hide folds it away.
Hover and pick. Hovering over a member or node shows its name and, after an analysis, its value at the pointer. Where several objects lie under the pointer, a chooser lists them; Tab cycles through the list and a click picks one (Figure 4.1).
2.5 Modelling toolbar
The vertical toolbar on the left edge of the model view holds the drawing and editing tools. Hover over a button for its name and shortcut. Chapter 4 explains each tool; in order from the top the groups are:
- Selection: select (S), box, crossing, polygon, select by property, select by coordinate range, previous selection, selection filter (All, Nodes, Members, Areas) and clear.
- Drawing: nodes (N), frames (E), quick-draw on a grid line (Q), area by corners (A), area on a grid cell, grid lines by spacing (G), snaps and working plane, area properties.
- Editing: delete, move, replicate (R), divide, merge nodes, extrude, node coordinates table and groups.
- Supports: fixed, pinned, roller, spring and remove.
- Tools and panels: script console (`), AI model builder, and the switches of the left panel ([), the tables (T), the properties panel (]) and focus mode (F11).
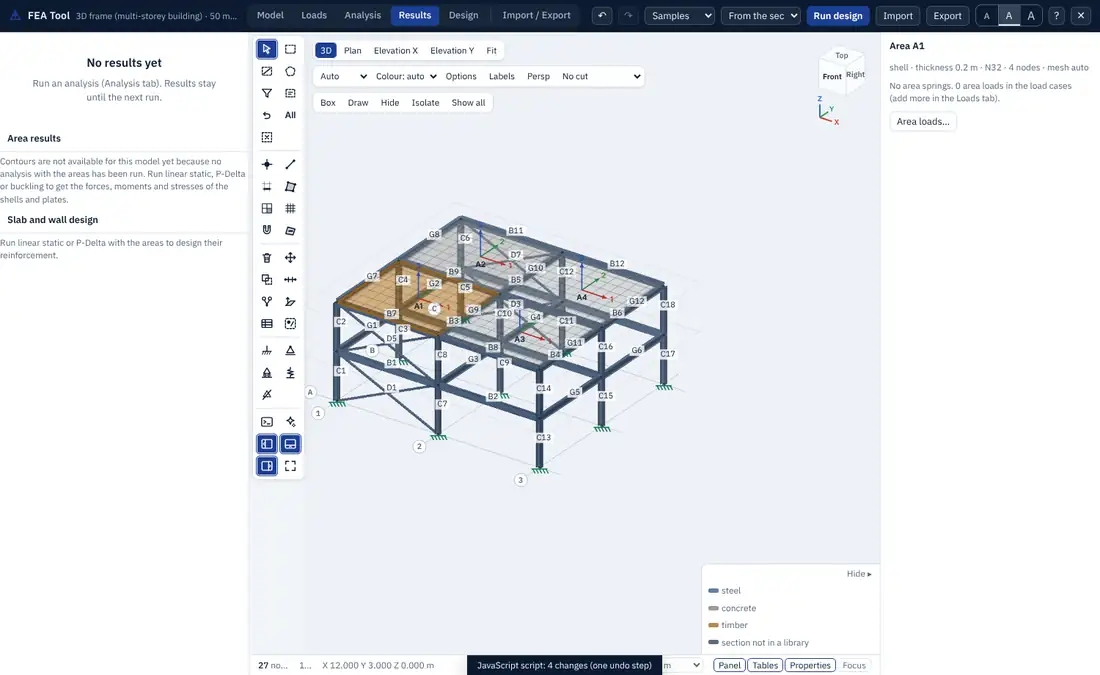
2.6 Properties panel
The properties panel on the right follows the selection.
- Nothing selected: a summary of the model (members by role, sections, load patterns, combinations and the code).
- A node: the members it joins, its displacements in every case after an analysis, its coordinates, restraints (Ux to Rz) and springs, all editable.
- A member: role, type, length and end nodes; after an analysis the member force diagram of any component and case with its maximum and minimum and the values at the stations; then the analysis model (section, material, roll angle, type, end releases), the compression flange lateral restraint, and the design with Open in module.
- An area: type, thickness, material, node count and mesh, its area springs and loads, and Area loads....
- Several objects: what they have in common, and the actions that apply to all of them (design, hide, isolate, delete).
2.7 Tables in the bottom dock
The bottom dock holds the result tables: Displacements, Reactions and Member forces after any analysis, and further tables after the analyses that produce them (modes, buckling, pushover, area results, storeys). Each table can be sorted by a column header, filtered by text, copied, saved as CSV and opened in its own window.
Rows and the model are linked both ways. Hovering over a row marks its node, member or mode in the model; clicking the row selects the object and frames it. Selecting objects in the model marks their rows, and Selection limits the table to the selection. Zoom to frames the selected rows in the view. Values are shown in the display units with engineering formatting.
2.8 Status bar and display units
The status bar along the foot of the model view shows the number of nodes and members, the selection, the coordinates of the pointer on the working plane, notes from the view (for example that lines are drawn instead of sections), and the Units selector.
The units selector changes how numbers are shown and typed in the whole window. The analysis, the model file and every stored load stay in kN and m; only the presentation changes. The choice is kept in the browser and saved with the model.
| System | Force | Length | Displacement | Stress | Area load | Mass | Temperature |
|---|---|---|---|---|---|---|---|
| kN, m (default) | kN | m | mm | MPa | kN/m² | t | °C |
| kN, mm | kN | mm | mm | MPa | kN/m² | t | °C |
| N, mm | N | mm | mm | MPa | kN/m² | t | °C |
| MN, m | MN | m | mm | MPa | kN/m² | t | °C |
| kip, ft | kip | ft | in | ksi | ksf | kip | °F |
| kip, in | kip | in | in | ksi | ksi | kip | °F |
| lb, in | lb | in | in | psi | psi | lb | °F |
| lb, ft | lb | ft | in | psi | psf | lb | °F |
| tonf, m | tonf | m | mm | tonf/m² | tonf/m² | t | °C |
| kgf, cm | kgf | cm | mm | kgf/cm² | kgf/cm² | kg | °C |
Temperatures are differences, so 1 °C shows as 1.8 °F. A value typed in a form is read in the display unit shown in its label and stored in SI at once, so changing units later converts it.
2.9 Minimise, focus and panel sizes
The four panel switches at the bottom of the modelling toolbar, and the Panel, Tables, Properties and Focus buttons at the right of the status bar, show or hide the left panel ([), the bottom dock (T) and the properties panel (]). Focus (F11) hides the panels, the tables and the header so the model fills the window; press F11 or Esc to leave it. Drag the edges of the panels and the dock to resize them. The window remembers the layout in the browser.
2.10 Keyboard and mouse
| Keys | Action |
|---|---|
| 1, 2, 3, 4 | 3D, plan, elevation X, elevation Y |
| F | fit the model in the view |
| M | members as sections or lines |
| L, P | member labels, perspective |
| B, D | box select, draw members |
| H, I, Shift+H | hide the selection, isolate it, show everything |
| S, N, E, Q, A | select, draw nodes, draw frames, quick-draw, draw areas |
| G, R | grid lines, replicate |
| Ctrl+A | select all members |
| Delete | delete the selection |
| Ctrl+Z, Ctrl+Y | undo, redo |
| Ctrl+S | save the model (JSON) |
| Ctrl+Enter | run the analysis |
| Space | animate the mode or play the time history |
| comma, full stop | previous or next mode or time step |
| T, [, ] | tables, left panel, properties panel |
| Z | zoom to the selection |
| V | values on diagrams and reactions: compact labels or on hover |
| Enter | open the selected member in its design module |
| Alt+1 to Alt+6 | Model, Loads, Analysis, Results, Design, Import / Export |
| ` | script console |
| F11 | focus mode |
| Tab | next object under the pointer (object chooser) |
| Esc | stop the tool, close a dialog, close the window |
| ? | the list of shortcuts |
With the mouse, drag to orbit, right-drag or Shift-drag to pan, use the wheel to zoom and Ctrl-drag to box select.